Debugging and monitoring SQL Server databases are essential tasks for database administrators and developers. Sometimes, your application might not throw an error, yet it fails to produce the expected output after CRUD operations. In such cases, you’ll want to investigate what’s happening within the database. For these tasks, SQL Server Profiler emerges as a valuable tool. In this comprehensive guide, we’ll delve into Profiler’s capabilities, demonstrating its effectiveness for debugging, performance tuning, and tracking both SQL queries and stored procedures. Remember when I welcomed you to this blog, I said one of the categories of articles on the blog would be SQL Server. So this is the first of many.
A Closer Look at SQL Server Profiler
SQL Server Profiler, a versatile graphical tool provided by Microsoft SQL Server, allows you to capture, analyze, and troubleshoot events and data generated by SQL Server instances. With its real-time insights, it’s an indispensable component in your database management toolkit. It enables you to monitor database hits, including system and user-created databases, helping you identify executed queries and SQL statements that reach the Database Server.
Using SQL Server Profiler for Debugging and Monitoring
- Identifying Performance Bottlenecks
Profiler excels at pinpointing performance bottlenecks within your database. By capturing events such as query execution times, CPU usage, and disk I/O, you can identify queries or stored procedures that consume excessive resources, affecting system performance.
- Tracking Query Execution
Profiling assists in tracing the execution path of specific queries or stored procedures. By configuring a trace to capture statements, parameter values, and execution plans, you gain insights into why a query or stored procedure might exhibit unexpected behavior or slowness.
- Monitoring Locking and Blocking
Issues related to database locks and blocking can significantly impact overall database performance. Profiler can capture events related to locking, including deadlocks, helping you identify processes involved in blocking and take corrective actions.
- Auditing Database Activity
Security and compliance remain paramount concerns for many organizations. SQL Server Profiler serves as a valuable tool for auditing database activity, including the execution of queries and stored procedures. By capturing events linked to these executions, you can track who is executing what queries and procedures, providing valuable insights for auditing and security purposes.
How to Track Recently Executed SQL Queries and Stored Procedures
To track recently executed queries and stored procedures using SQL Server Profiler, follow these steps:
- Launch the Profiler from the Management Studio (SSMS) Tools Menu or as a standalone application.
- Create a new trace.
- Select the events you want to capture. For tracking queries and stored procedures, focus on relevant events like “SQL:BatchCompleted,” “SQL:BatchStarting,” “SP:Completed,” and “SP:Starting.”
- Configure filters to target specific databases, applications, or users if necessary.
- Start the trace and allow it to run while you execute the queries and stored procedures you intend to track. You can pause the trace after running the query or procedure to avoid excess data.
- Analyze the captured data to identify recently executed queries and procedures, including their execution times, parameters, and associated events.
- Save or export the trace data for future analysis, performance tuning, or compliance purposes.
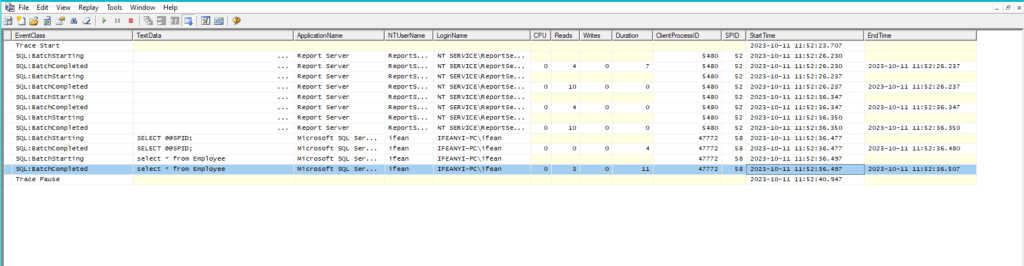
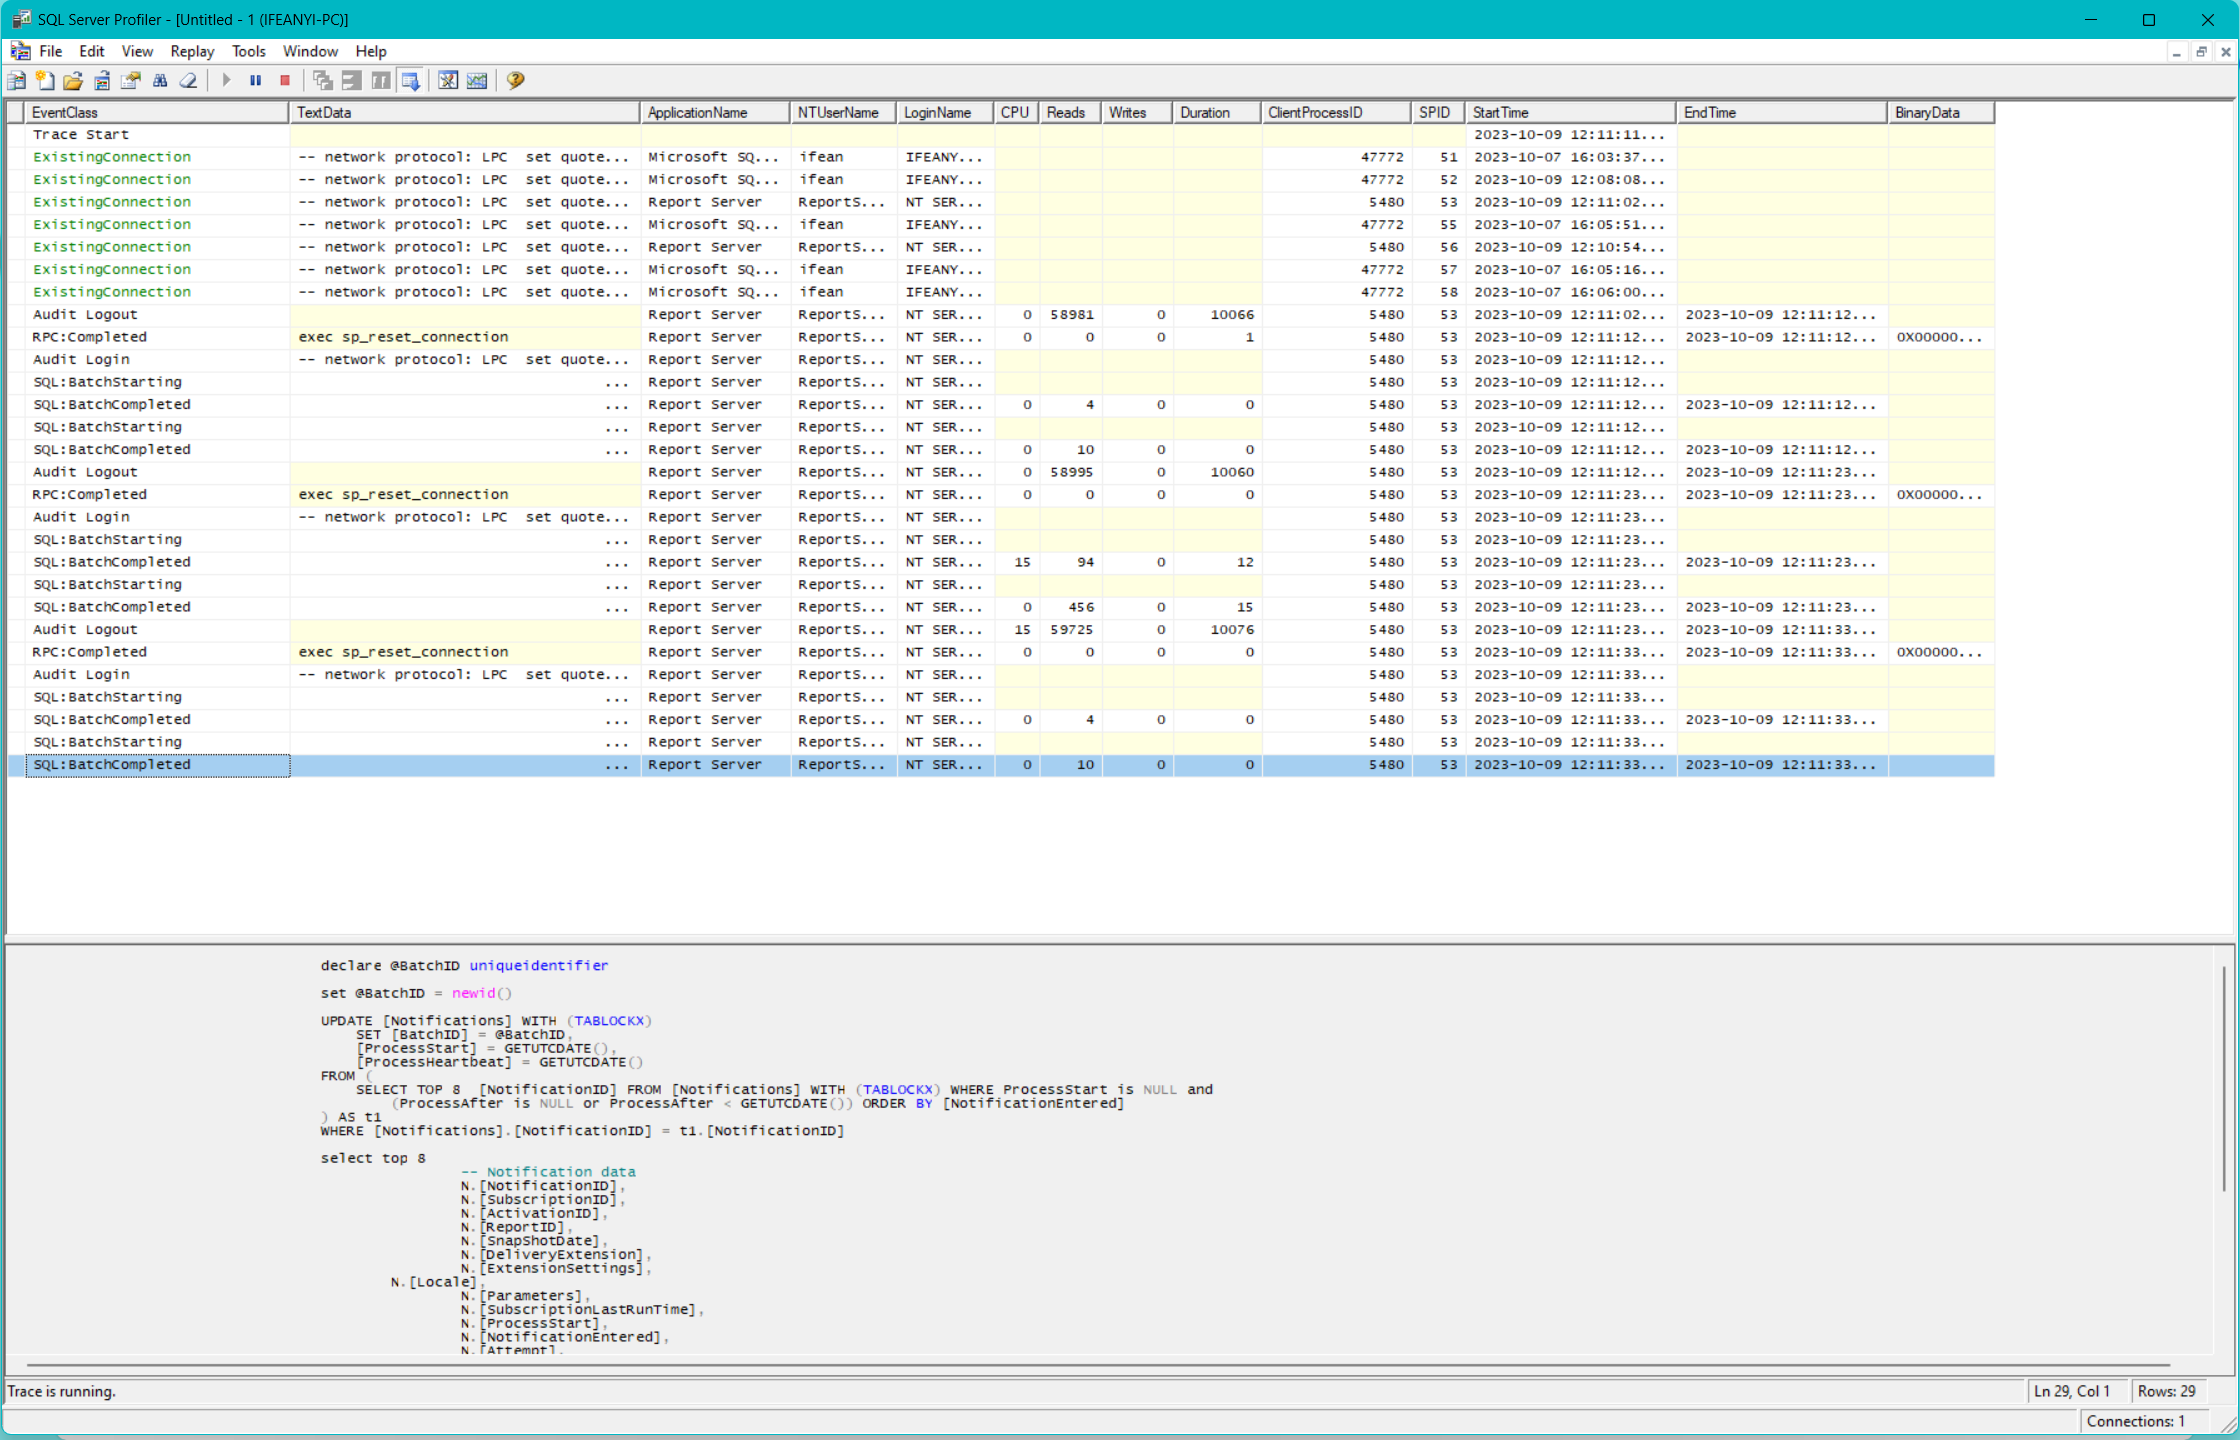
You can see from the above screenshot, the details of a query that I ran on the database and you can view the details and the exact query that I ran. You can see I also paused the trace to not allow too many other procedures and queries to run that I have to start scrolling or looking for the query I ran. It also gives more insight into time, duration, CPU, reads, and others.
Conclusion
SQL Server Profiler is an indispensable and powerful tool for debugging, performance tuning, and monitoring SQL Server databases. By capturing and analyzing real-time events and data, you can gain deep insights into query performance, locking issues, and recently executed queries and stored procedures. Incorporating Profiler into your database management and debugging toolkit can help you maintain a healthy and efficient database environment. The next time you encounter a database-related issue or need to track recently executed queries and procedures, turn to Profiler for insights and solutions.